It probably doesn’t come as a surprise that protecting natural resources requires knowing what and where the resources are. Likewise, planning requires that we find the most suitable area for a proposed activity. In the past, many hours of field work were the only way to accomplish this. As much as we enjoy spending our time outdoors, we know it’s in our clients’ best interest to learn the what and where expeditiously. That’s why we are committed to staying at the forefront of technology and methods that not only save time but allow us to do things we might not have been able to in the past.
A geographic information system (GIS) is a powerful tool not only in its ability to create maps and store data, but its analysis capabilities can help identify resources, identify suitable habitat based on modeling, and prioritize restoration efforts. Remote sensing of landform, hydrologic, and vegetative features via geospatial data analysis has become increasingly easier and accurate in recent years due to the frequent updating of high-quality GIS data. We have the expertise to perform suitability modeling and classification of remotely sensed imagery to identify priority habitats and associated ecological communities for detailed inventory.
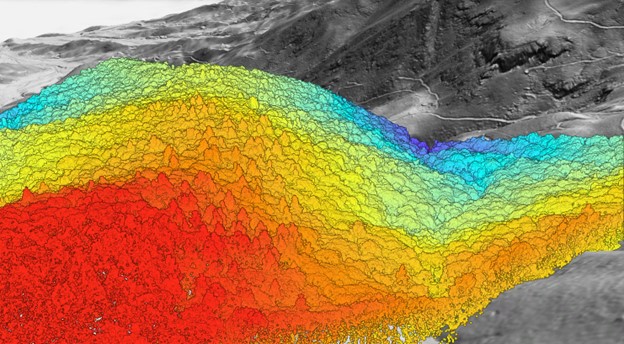
At Equinox we have been working on a wetland identification model to predict wetland locations in in the Blue Ridge. The model uses high resolution elevation data to derive topographic metrics that describe hydrologic drivers of wetland formation and uses these as predictors of wetland areas through a statistical algorithm. This is important because some of the rarest wetlands in the southeastern United States are the non-alluvial wetlands of the Blue Ridge region. These wetlands (bogs and headwater seeps) typically support globally rare plant communities that harbor many rare and endemic plant species and are therefore top conservation priorities. By using the wetland identification model to systematically predict the presence of montane seeps and bogs, then verifying through ground-truthing, we can delineate the extent of these important hydrologic areas of interests and assess their quality and vegetative structure more efficiently than with traditional methods.
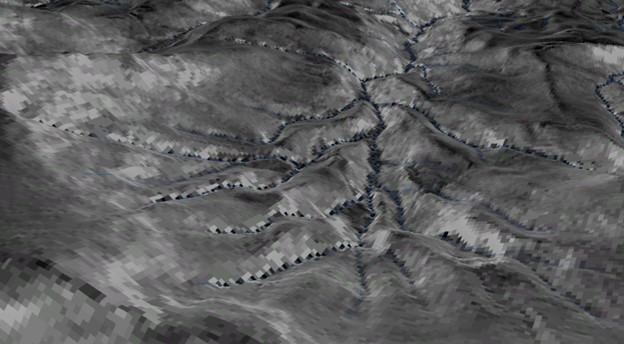
We use similar tools to analyze elevation data and produce models of canopy height, shape, and roughness, qualities that can be good indicators of forest stand type and age. These are useful in planning for fieldwork in large areas, especially when searching for old growth forest remnants.
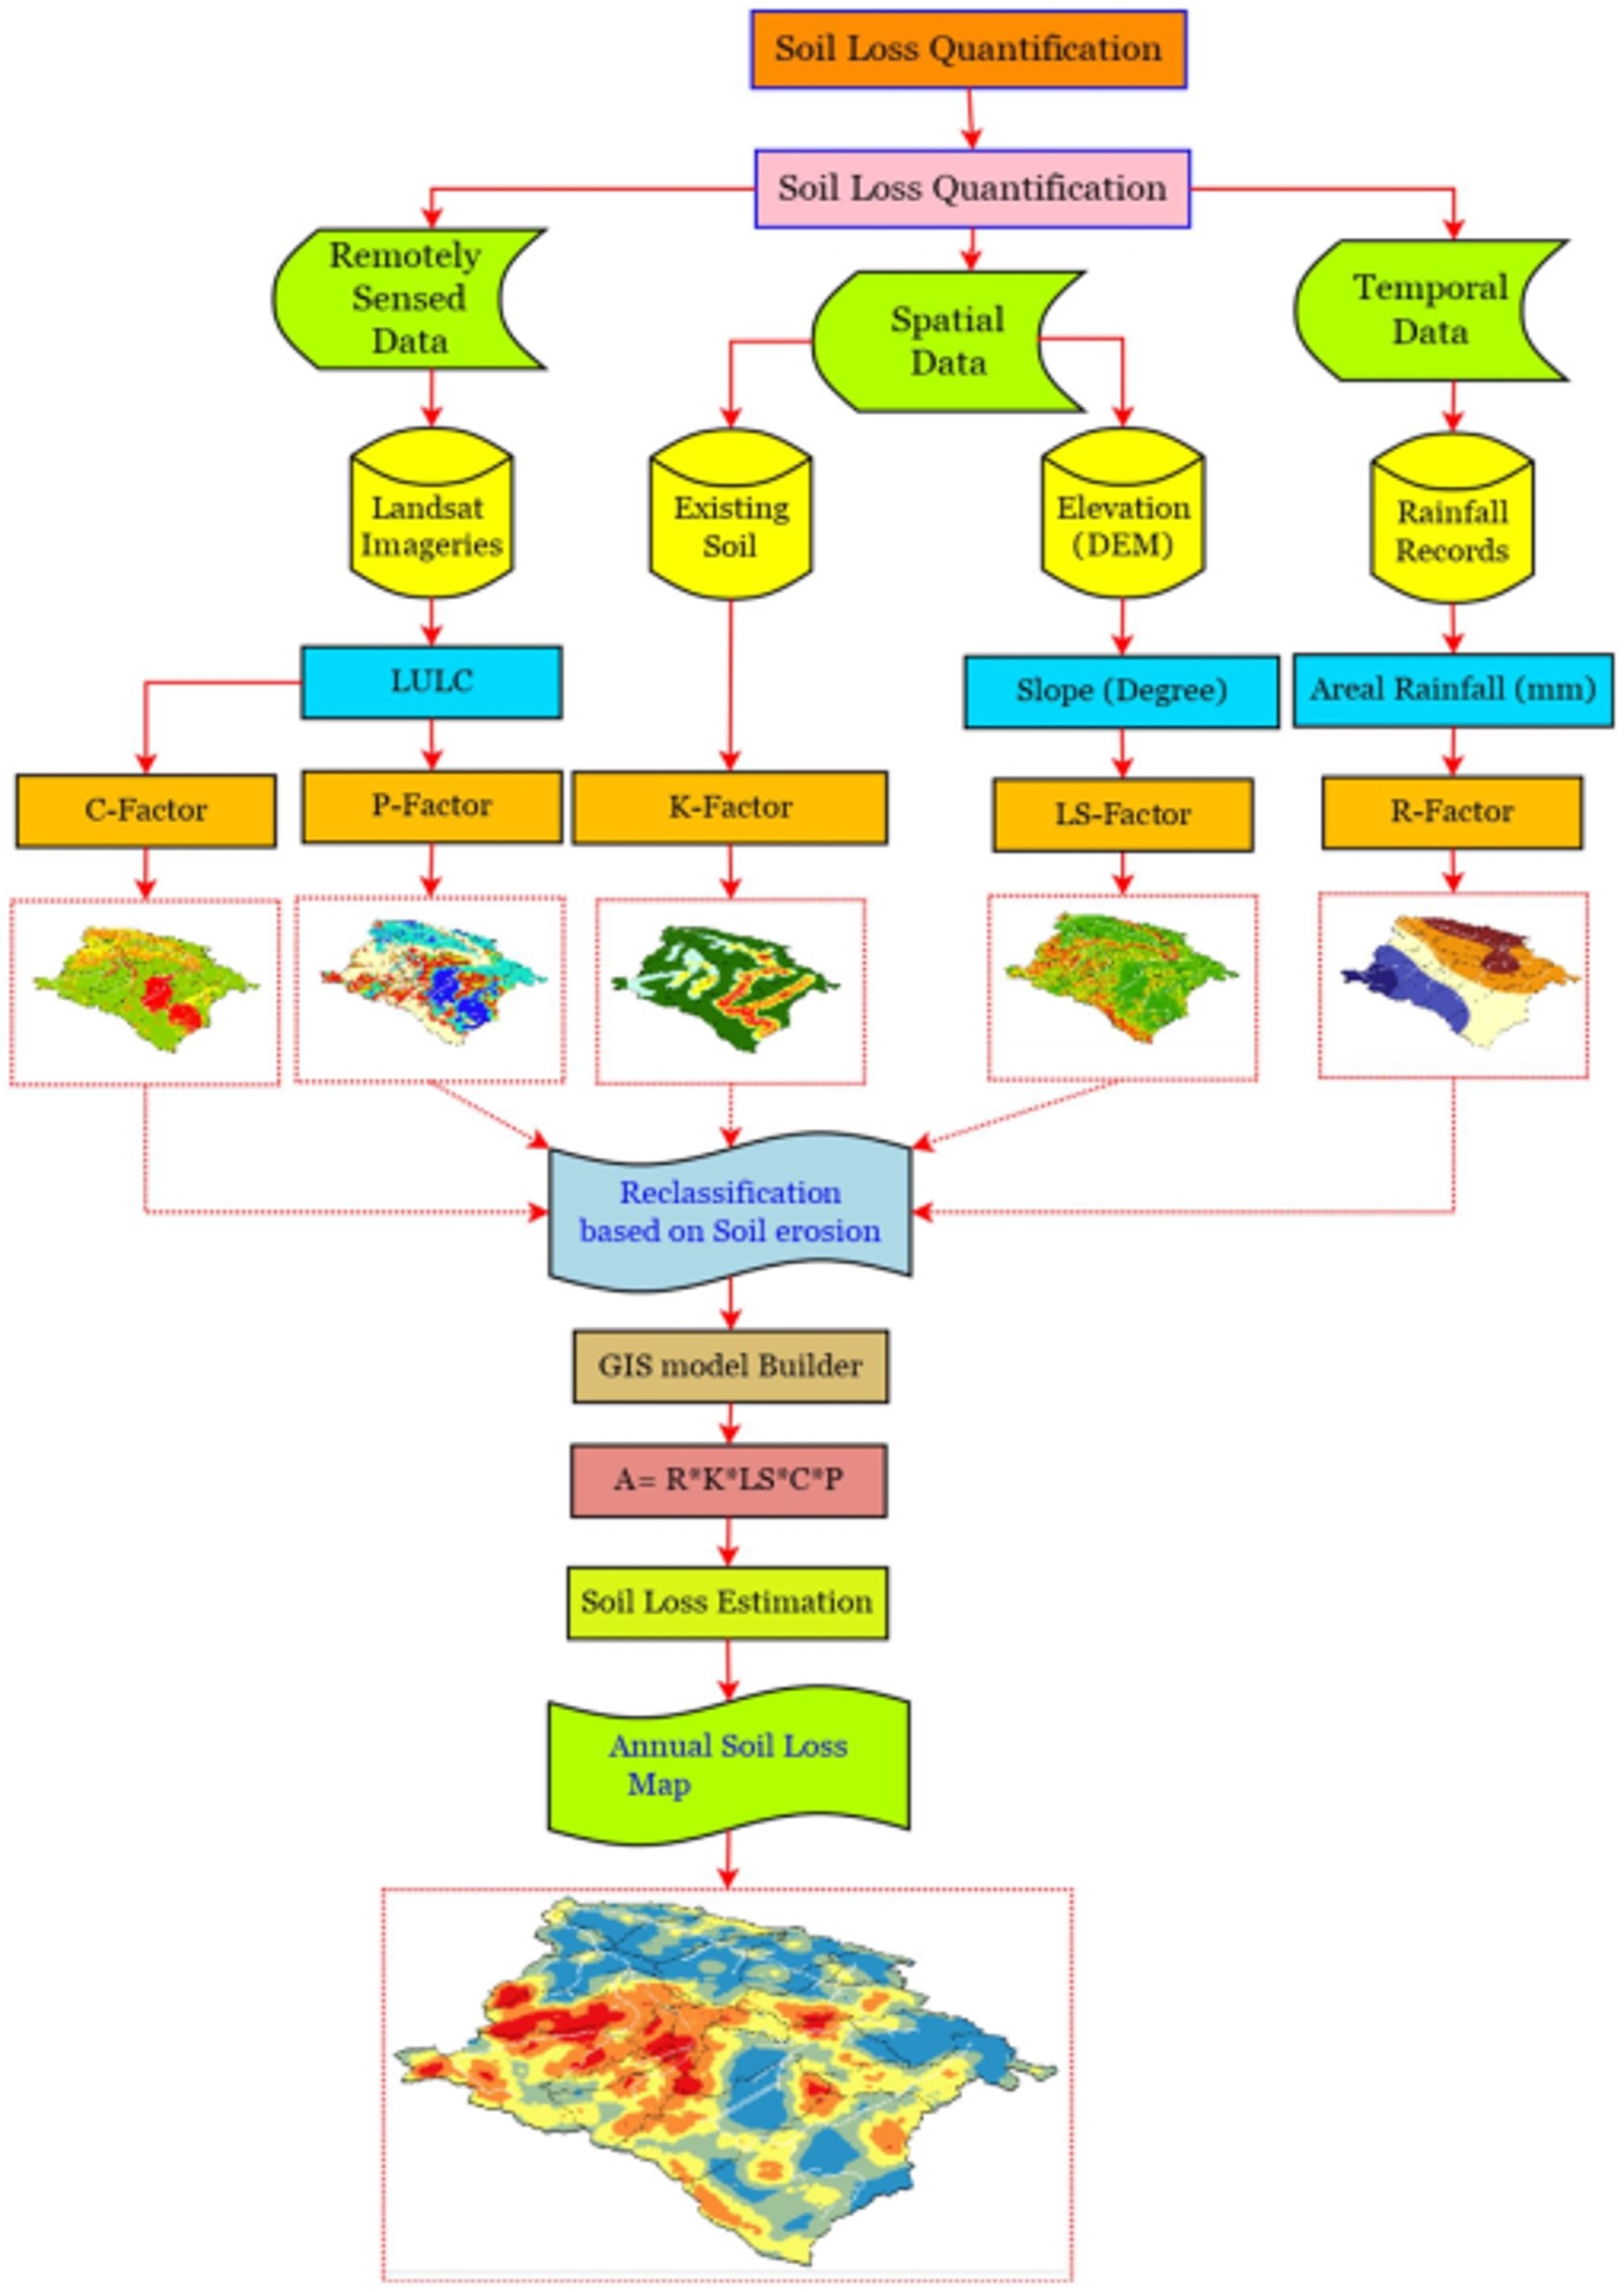
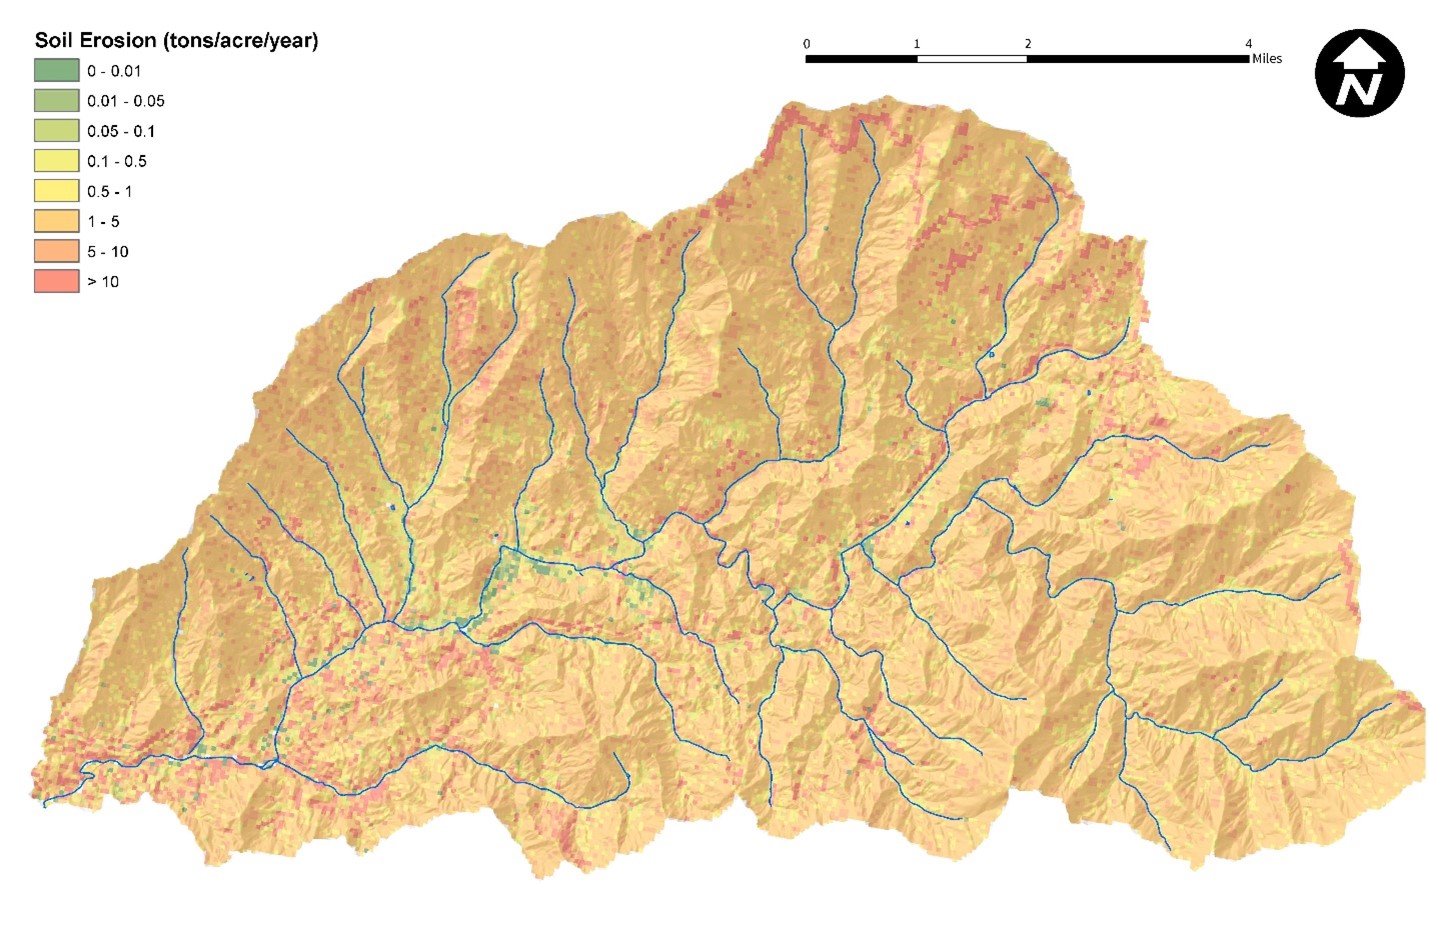
Prioritization of restoration efforts at the subwatershed and stream reach-scale can be achieved using GIS data and analysis. Indicators used in prioritizing stream restoration include the amount of riparian land within the watershed, the amount of land that has a land use or land cover type (LULC) that significantly contributes to non-point source pollution, how much of that land is in close proximity to streams, and average annual estimated erosion. The process and results for quantifying soil loss using GIS analysis is depicted in the following figures.